It’s complicated…
Limitations on travel have been one of the defining aspects of the pandemic. The most recent surge in Omicron Covid-19 is an unfortunate microcosm of the complex public health environment that we’re navigating. Just as many vaccinated Americans were planning their holiday travel, this new, more virulent variant emerges. These rapidly-evolving circumstances are likely to generate volatility in consumer sentiment and behavior, ones that are important for brands to understand. To better understand how consumers are feeling about holiday travel this year, we fielded a simple, one-question open-ended survey with a national, general population sample via Google Surveys. We asked: “Please describe how you feel about holiday travel this year.” At the time of this writing, we had collected 314 responses.
One of the selling points of Canvs is the ability to extract both emotion and codes and topics from open-ended text and to do so quickly and accurately. So while most customers wouldn’t field a survey with only open-ended questions (would they?), we can actually extract quite a bit of information from a single open-ended question. Let’s take a look.
Twenty percent (20%) of respondents indicated that they are not traveling. While not dispositive as an indication of the percent who are traveling (or not), this kind of categorical coding is helpful if we want to specifically look at the emotional response or sentiment of those who indicate their not traveling. Obviously, the addition of a closed-ended response as a filter or cross-tab here would provide a more accurate way of creating a cohort.
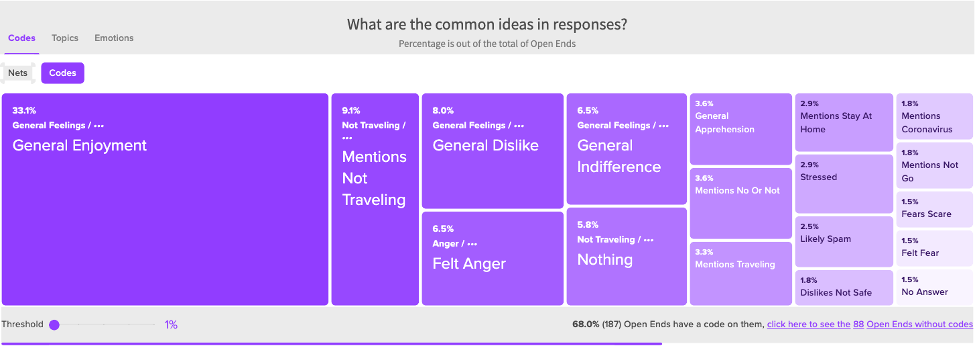
As seen in the treemap graph above, 33% of respondents indicated “General Enjoyment” regarding holiday travel, while 8% indicated “General Dislike.” In these cases, Canvs is coding a variety of “natural language” responses into each of these code categories.
The open end we used for this survey specifically invites an emotional response, so it’s not surprising that we say a 45% emotion rate (i.e. 45% of the open ends expressed emotion according to Canvs’ analysis (which favors confidence over completeness).
Topline Emotion results:
The highest emotional response is split evenly between Enjoy and Dislike (23% of emotions)
11% are feeling Worried or Afraid
10% expressed Love

Things get more interesting when we start to look at these emotions through the lens of cross-tab filters.
Interestingly, we don’t see any significant shift when comparing women and men. Twenty-four percent (24%) of women and men each expressed “Enjoy” as the top emotion, however Worried or Afraid registered slightly higher as an emotion for women (14%) vs. men (9.3%).
Regional differences have been a hallmark of the pandemic both in terms of responses (red vs. blue, etc.) and actual case rates. In our survey, we noted some interesting attitudes and emotional differences based on geography.
Geographic findings: (note: Google surveys categorizes respondents into one of four geographic regions by state: Northeast, South, Midwest and West.)
Northeast: Respondents from the Northeast region are the most likely to express enjoyment about travel (36%), but also the most likely to express Worried (14%).
South: South region respondents also registered high Enjoyment emission (30%), but also considerable dislike (26%). Interestingly, the emotions of Worried or Afraid (not shown) were among the lowest in this cohort (8.5% combined).
Midwest: Perhaps due to the breadth of states in the Midwest region, emotions were somewhat spread, with Dislike (19%), Indifferent (18%), and Enjoyment (18%) all within a few percentage points as the top feelings. This region had the highest percentage of Afraid emotion expressed (8.8%, not shown).
West: The West is also a large and diverse region, so it is interesting to see both the spread and concentration of emotions expressed here. While Dislike was the highest emotion expressed (29%), Enjoy and Love each was expressed by 18% of respondents (36% of total respondents).

We’ll wrap up by taking a look at some of the verbatims behind all the feels. Given the complicated range of emotions captured in this question (doubly loaded holiday- and travel-related emotions!) drilling into the actual response verbatims helps give shape to the narrative. Here we see a range of responses, from concerns about the price of gas and what would normally be typical concerns about the crowds, to some specific comments regarding the state of the pandemic.
“Very expensive as gas prices are soaring”
“Too crowded due to the pandemic years”
“Not much think it going to be bad out there”
“Don’t like it but must if I’d like to see my grandson”
“Do not feel comfortable traveling this holiday season. So we are going nowhere.”
If you’re interested in exploring these findings for yourself, you can access the Canvs insights dashboard with this data preloaded at https://app.canvs.ai/share/s/9vVpJjBM.
Finally, however you might be feeling about holiday travel this year, we at Canvs wish you a very happy holiday season and happy, healthy and prosperous 2022!