Canvs AI Integrations
Streamlining research operations with flexible data input and export
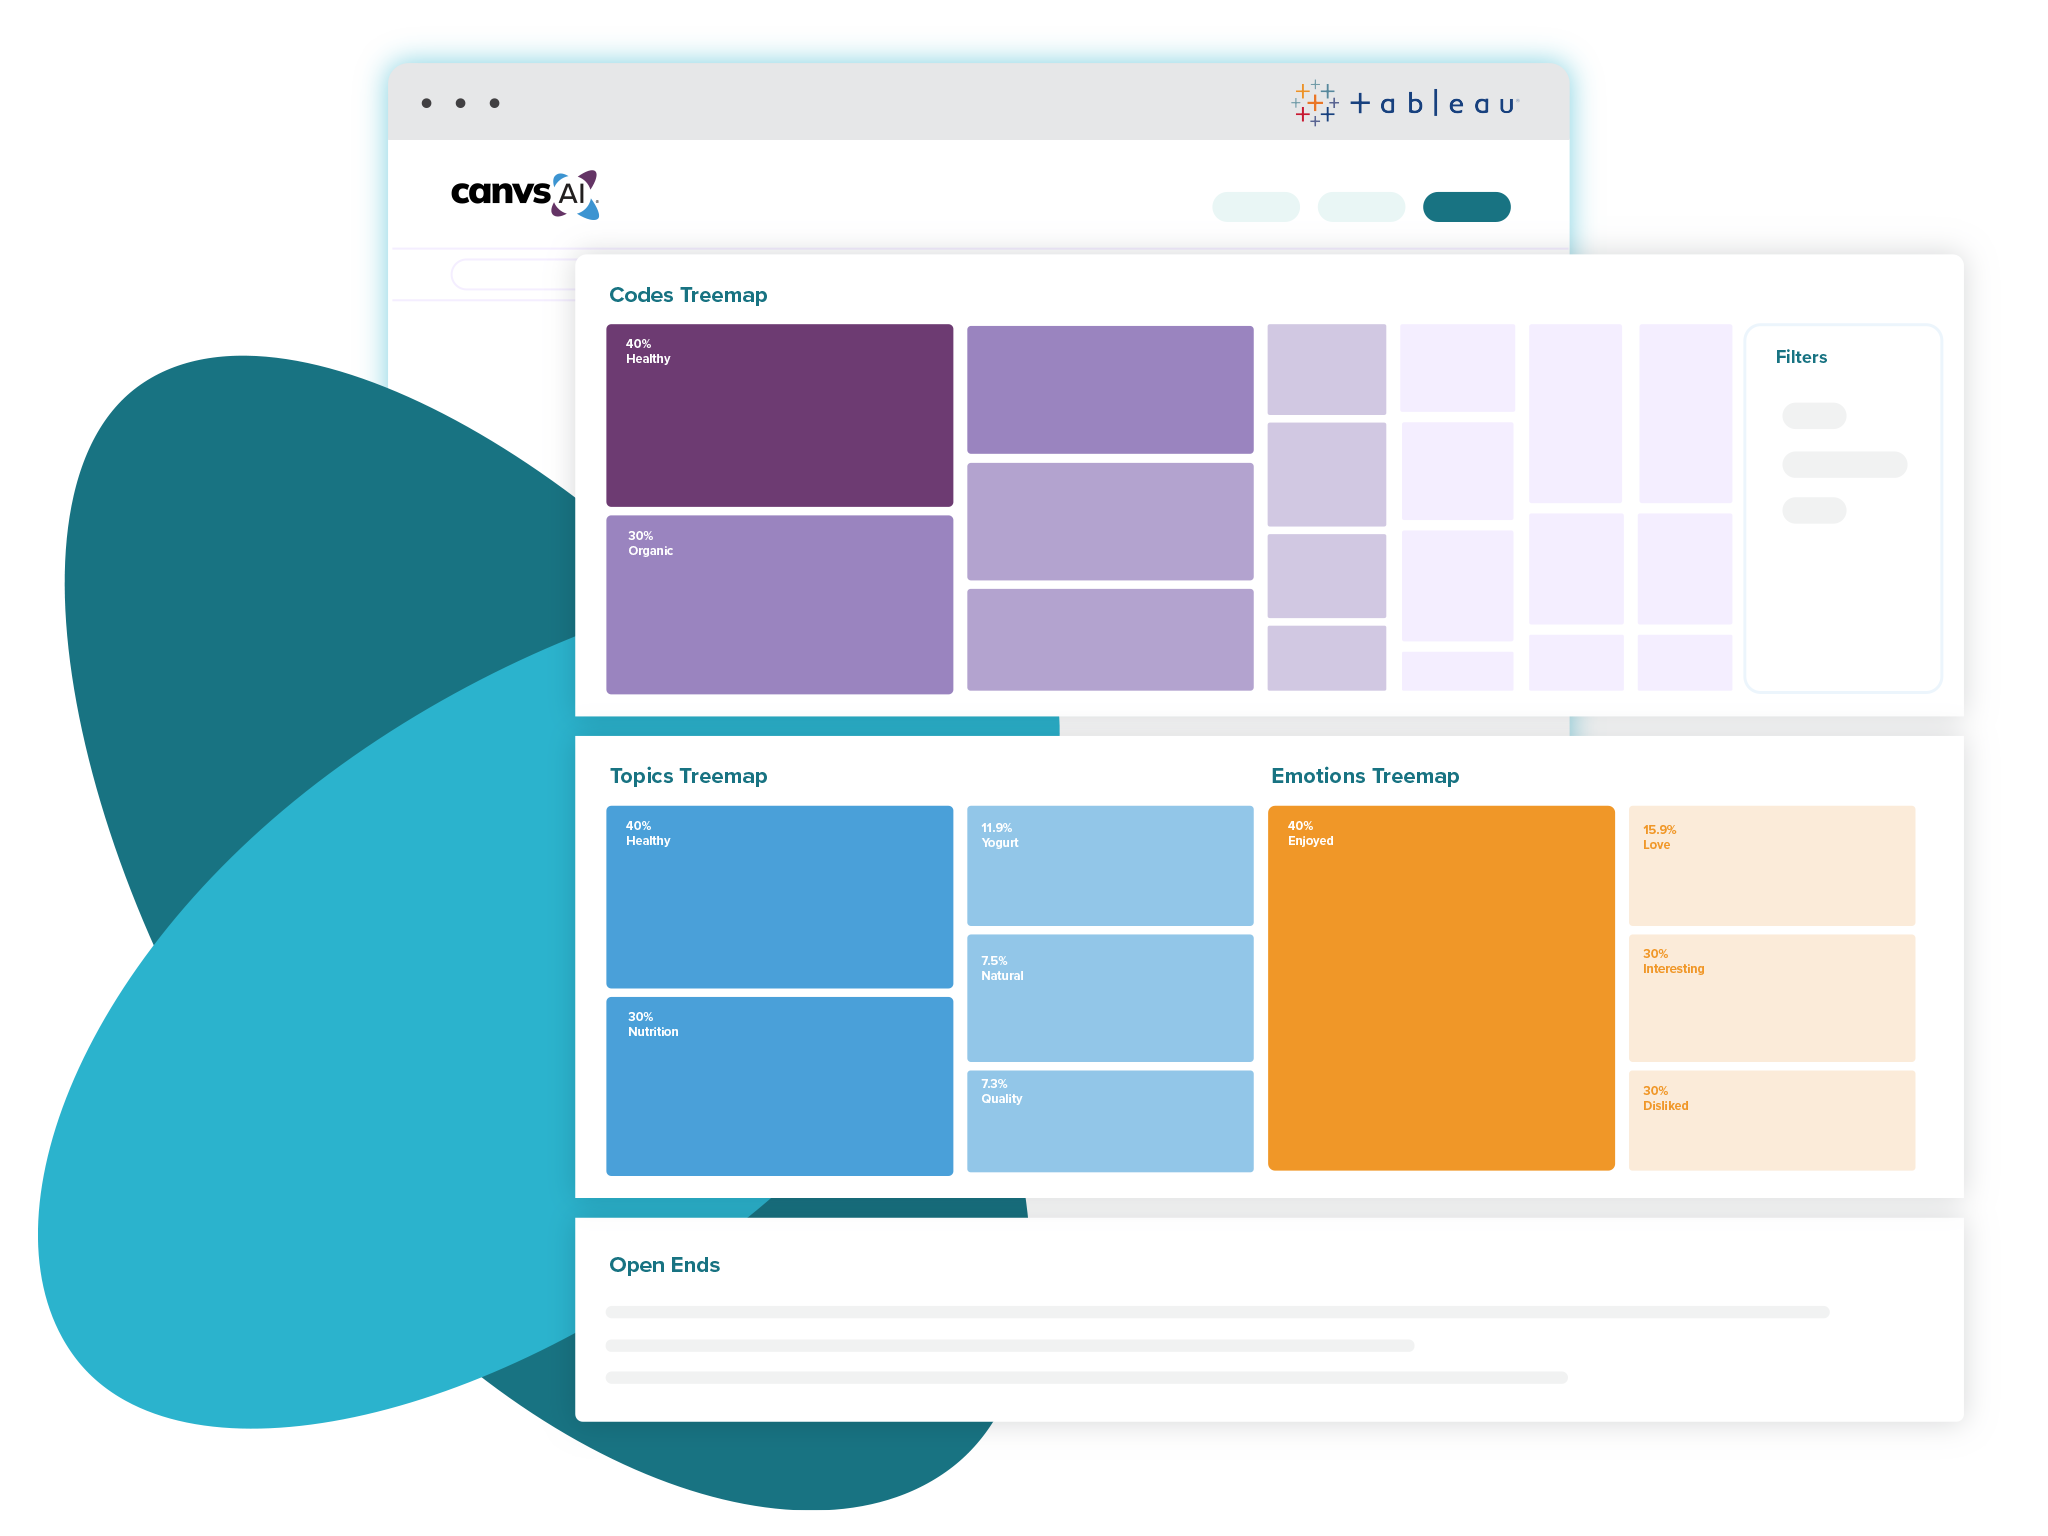

As a “bring your own data” insight platform, Canvs sits in the center of the research process. We’ve designed Canvs for flexible input and output of data, including robust APIs to support both integration with data sources, like survey platforms, as well as with BI tools, like Tableau, Power BI and Looker.
Streamlining Research Operation

Flexible Data Input
Canvs makes it easy to ingest data from virtually any source using a guided upload process from xls and csv files. We offer a growing set of connectivity options to upload data from leading research and insights platforms. Additionally, the Canvs APIs can be used to develop custom integrations.
Automated Reporting &
Data Exports
Analysis and insights can be extracted from Canvs in multiple ways to suit your business. This includes the ability to create links to custom, read-only views of the dashboard itself, the ability to export the data in a variety of excel, powerpoint and image formats, and integration with a growing list of popular business intelligence tools. Canvs APIs can also be used to build custom integrations.
Integrate with Reporting & BI Tools
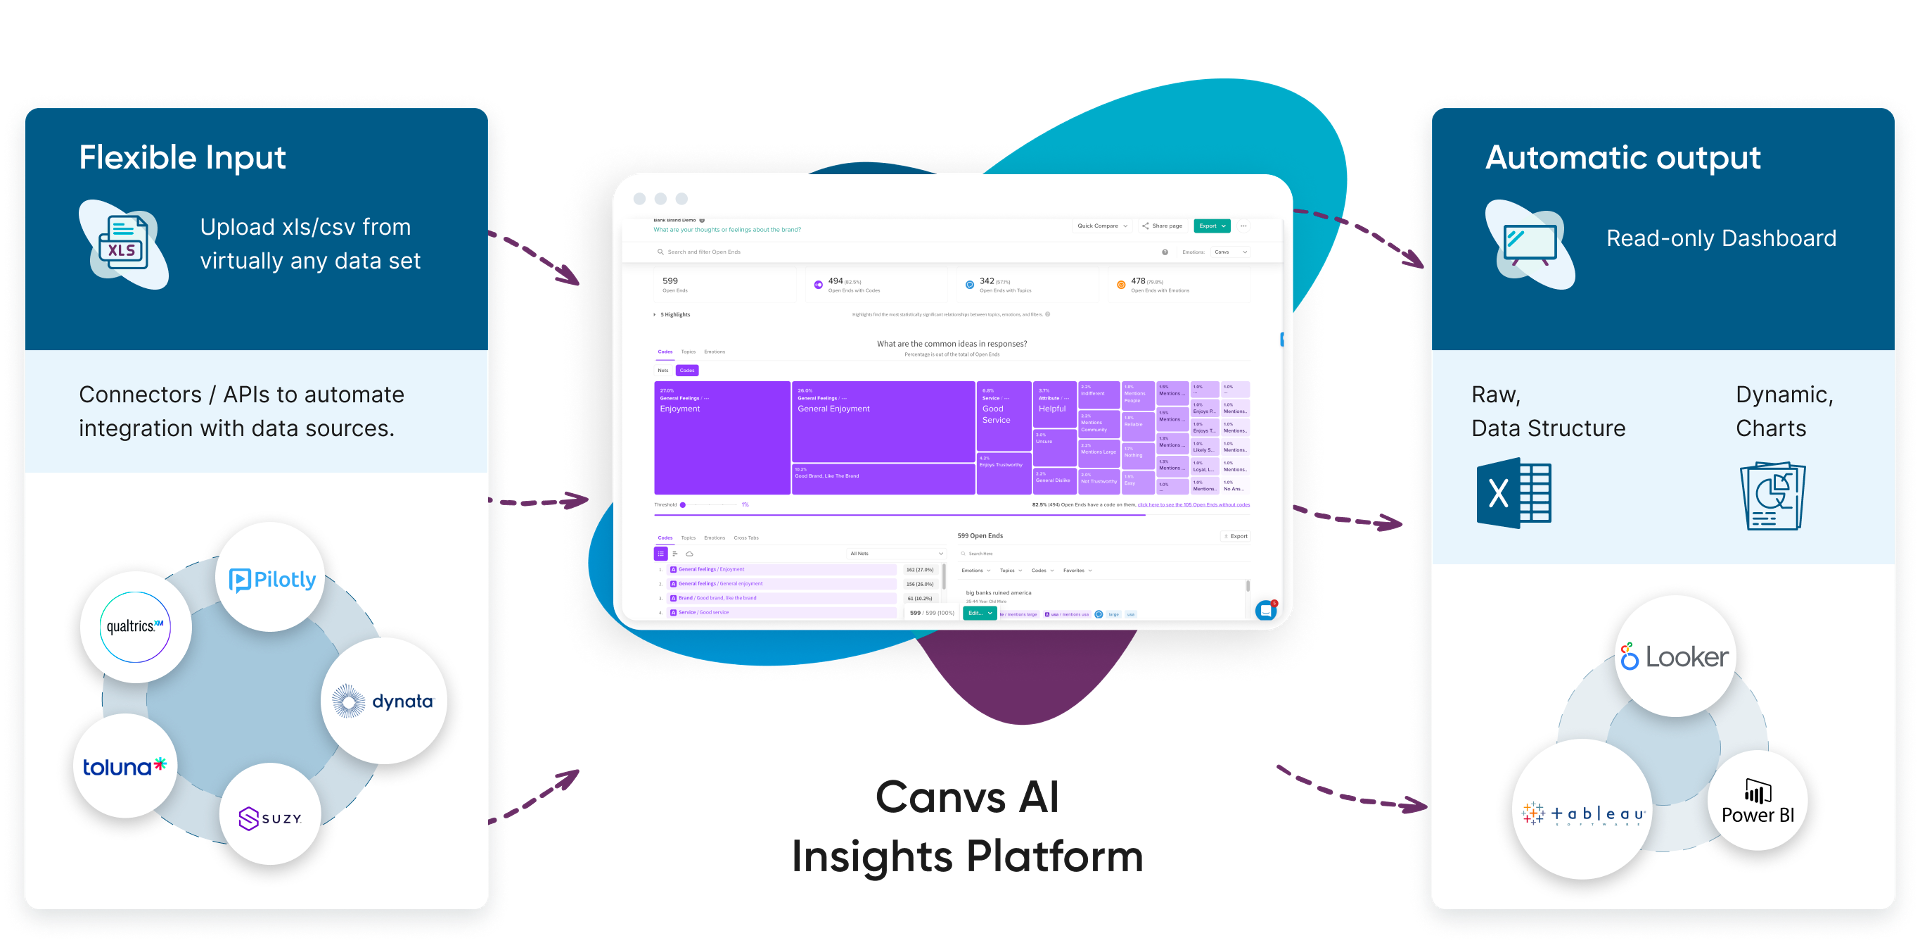
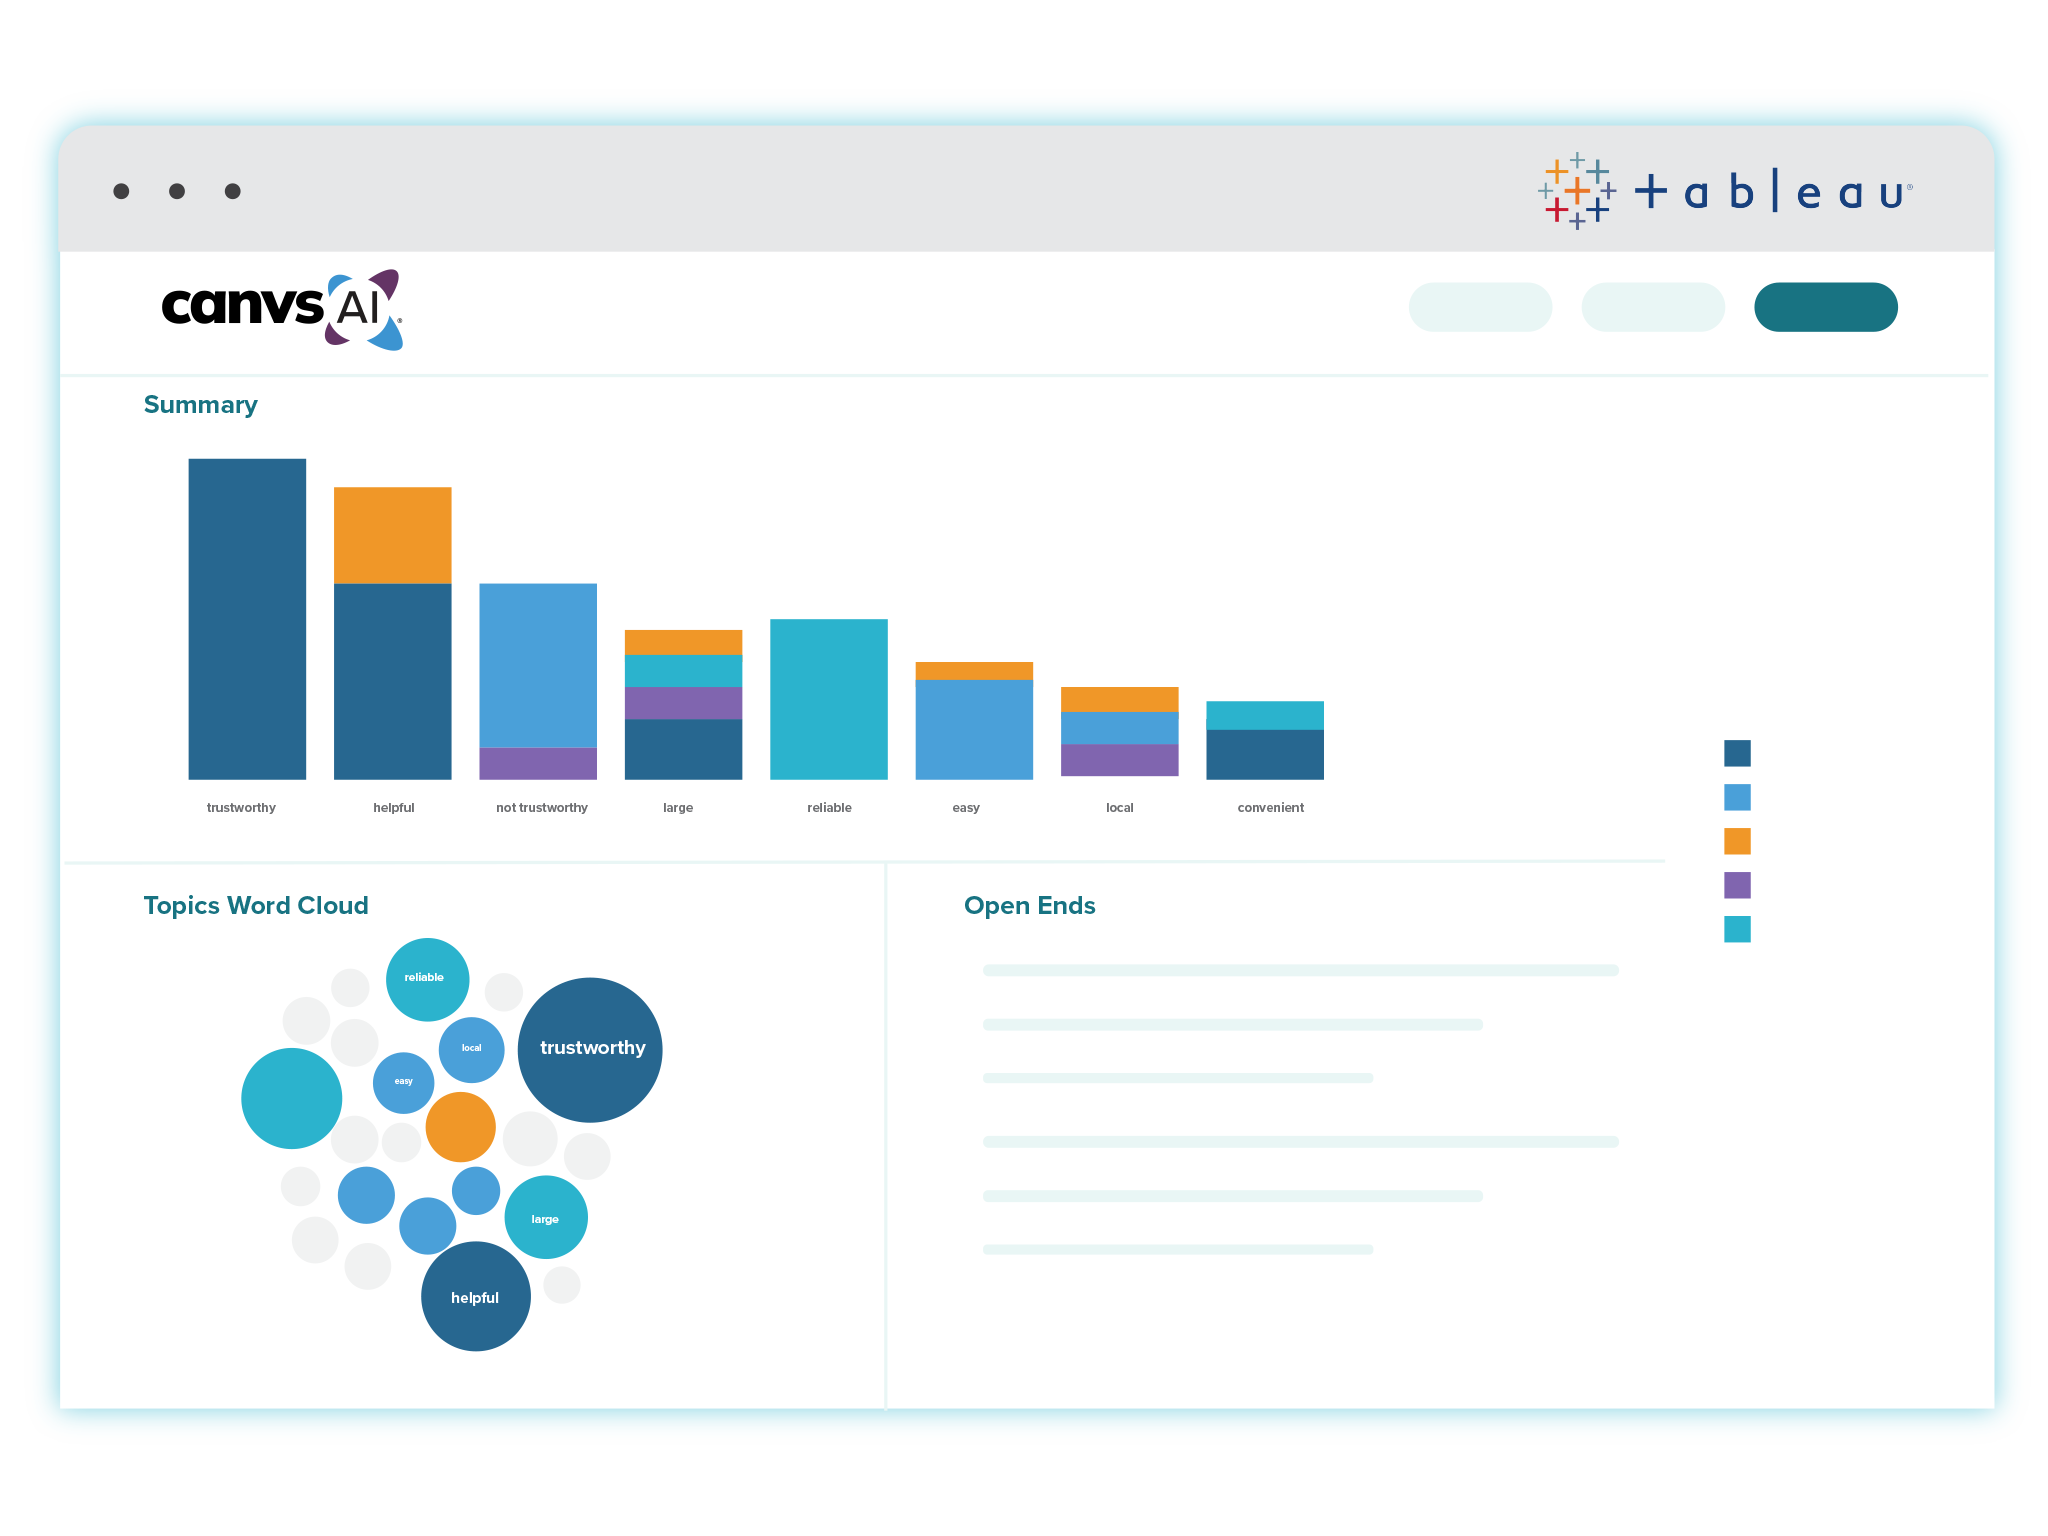
Canvs analysis can be included directly into business intelligence tools, such as Tableau, Power BI, Looker or Google Data Studio, allowing Canvs metrics to live with other KPIs you are tracking.

Ready to get started?
We’d love to hook you up with a demo so you can experience Canvs for yourself.
